
What's Driving Demand in Cave Spring: Migration & Demographics
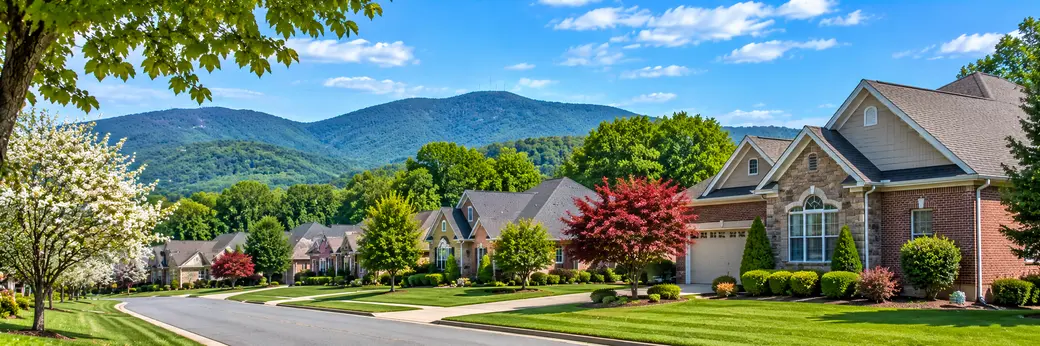
Cave Spring migration and demographics describe a stable, higher-income census-designated place, or CDP, in Roanoke County. During 2020 to 2024, 89.8% of residents age 1 and older lived in the same home as one year earlier, while 10.2% lived elsewhere the prior year. That measured turnover matters to relocators and investors because demand is shaped less by rapid churn and more by households seeking an established setting, practical commutes, and homes that can serve changing needs.
Cave Spring Migration and Growth Quick Reference
Cave Spring's clearest demand signals are household stability, mature demographics, and a substantial owner-occupied base (U.S. Census Bureau QuickFacts, 2020 to 2024).
| Metric | 2020 to 2024 estimate |
|---|---|
| Residents living in a different home one year earlier | 10.2% |
| Residents living in the same home one year earlier | 89.8% |
| Median age | 42.4 years |
| Owner-occupied housing rate | 69.5% |
Cave Spring Migration and Demographics: What the 2020 to 2024 Data Shows
Cave Spring's 2020 to 2024 data points to a selective household-mobility market rather than one defined by a single, fast-growing newcomer group. The median age was 42.4 during that period, above Virginia's 39.0 and the national median of 38.9. That age profile is consistent with demand from established families, mid-career professionals, and households thinking about longer-term ownership.
Income and education add important context. Median household income was $87,539 in 2024 dollars, and 48.8% of residents age 25 and older had earned at least a bachelor's degree. Those indicators support demand for homes with usable square footage, flexible rooms, reliable connectivity, and features that work across several life stages.
The CDP had 11,043 households and an average household size of about 2.3 people. That combination does not identify a single buyer type, but it does suggest that practical layouts remain important. Extra bedrooms, finished lower levels, home offices, guest space, and accessible main-level living can appeal to households whose needs are changing without requiring an immediate move.
The published CDP-level figures measure local household characteristics and one-year mobility, not ranked origin metros. For Cave Spring buyers and investors, the useful takeaway is that a stable population can make well-matched homes stand out when they become available, and watching Cave Spring homes as they come to market is the most direct way to see that in action.
What Is Drawing People to Cave Spring?
Cave Spring draws interest because its demographic profile combines established residential patterns with relatively strong household purchasing capacity. Median household income of $87,539 in 2024 dollars gives many households room to evaluate a purchase through the lens of condition, usable space, and location, not simply the lowest possible price point.
Education is another relevant signal. Nearly half of adults age 25 and older, 48.8%, held a bachelor's degree or higher during the 2020 to 2024 period. That does not define every household, but it aligns with demand for homes that support flexible work routines, dedicated office space, and rooms that can take on multiple uses over time.
Commute patterns add a practical advantage. Workers age 16 and older had a mean travel time to work of 20.0 minutes. For households balancing employment access with a residential setting, that commute profile can make Cave Spring an appealing place to prioritize home functionality and neighborhood stability.
Housing tenure reinforces the same theme. With a 69.5% owner-occupancy rate, Cave Spring has a substantial owner base. Owner-oriented communities can experience selective inventory because many households remain in place until a major life change, work shift, or space need creates a reason to move. That makes preparation, layout, and upkeep especially relevant when a property reaches the market.
The Remote-Work Effect on Cave Spring
Since remote work expanded, location-flexible households have had more reason to weigh home layout and lifestyle alongside daily commuting. Cave Spring's 48.8% bachelor's-degree-or-higher rate and 20.0-minute mean commute indicate a market where adaptable rooms can carry meaningful appeal for buyers with hybrid routines (U.S. Census Bureau QuickFacts, 2020 to 2024).
Age and Household Trends Shaping Cave Spring
Cave Spring's age profile leans older than both Virginia and the United States. Its 42.4 median age compares with 39.0 statewide and 38.9 nationally, indicating demand that spans established families, mid-career households, and owners planning ahead for future accessibility or downsizing decisions.
That does not mean Cave Spring is only an older market. A community with a mature median age can still attract households looking for a long-term home, particularly when a property offers enough flexibility to accommodate children, guests, home offices, or changing care needs. The result is broad demand for homes that can remain useful without a near-term renovation or move.
Household scale also matters. Cave Spring recorded 11,043 households with an average of about 2.3 persons per household during 2020 to 2024. Combined with a 69.5% owner-occupancy rate, that points to an ownership-oriented market where many homes are held for longer periods.
For real estate demand, the key implication is not that every household wants the same property. Rather, a stable owner base can increase the importance of adaptable space, move-in-ready conditions, and features that work for more than one stage of life.
What Cave Spring's Demographic Profile Means Locally
Cave Spring's demographic profile is best understood as an established Roanoke County residential market with relatively high household income, mature age characteristics, and a strong ownership base. The CDP's 42.4 median age, $87,539 median household income, and 69.5% homeownership rate point toward longer-term residency rather than rapid population cycling.
For property decisions, the combination of measured turnover and stable ownership is especially relevant. Buyers may be comparing condition, lot utility, accessibility, and flexible living space when suitable homes enter the market. Sellers can benefit from presenting those features clearly, and preparing a home for the market with that audience in mind helps, because households seeking a long-term fit may prioritize a home's practical usability over cosmetic details alone.
What the Mobility Measure Tells Us
Cave Spring's available household-mobility measure should not be read as an out-migration count. It shows that 10.2% of residents age 1 and older lived in a different home one year earlier, while 89.8% remained in the same home during the 2020 to 2024 Census estimate period.
An address change can reflect a move within Cave Spring, elsewhere in Roanoke County, or beyond the region. For that reason, the figure is most useful as an indicator of normal turnover within an established CDP, rather than evidence of a specific departure pattern.
For buyers, measured turnover means suitable homes may appear selectively rather than in a large, interchangeable supply. For investors, it suggests that rental and resale demand should be evaluated property by property, with close attention to layout, condition, and the alternatives available when a home is listed. The investment case for Cave Spring walks through that property-level thinking in more detail.
Pro-Tip: Watch the supply of move-in-ready homes with flexible living spaces. In Cave Spring, limited household turnover can make those properties a useful leading indicator of near-term buyer and rental interest.
What Migration Trends Mean for Cave Spring Real Estate
Cave Spring migration and demographics suggest that adaptable, well-maintained homes can appeal across multiple household stages. The area's 42.4 median age, $87,539 median household income, and 69.5% owner-occupancy rate support demand for properties that offer long-term usability rather than only a basic bedroom count.
Homes with a dedicated office, guest room, finished lower level, main-level bedroom, usable outdoor area, or flexible bonus space can meet the needs of professional households, families, and buyers planning for future changes. In a market where most residents remain in place from year to year, those practical features can distinguish between a listing.
Cave Spring's 2020 to 2024 housing-cost measures provide additional context:
| Housing measure | 2020 to 2024 estimate |
|---|---|
| Median owner-occupied home value | $325,800 |
| Median monthly owner costs with a mortgage | $1,668 |
| Median gross rent | $1,285 |
These figures are a broad area-level guide, not a price forecast for an individual property. Actual competition will depend on condition, location, available inventory, and how effectively a home meets current buyer needs.
FAQ: Migration and Demographics in Cave Spring
Is Cave Spring growing in population?
Cave Spring's 2020 to 2024 Census profile is more conclusive about stability and household mobility than annual population growth. It recorded 11,043 households, with 89.8% of residents age 1 and older living in the same home as one year earlier, according to U.S. Census Bureau QuickFacts.
Where are most people moving to Cave Spring from?
Cave Spring's published 2020 to 2024 Census profile does not provide a ranked list of origin metros or counties. It does show that 10.2% of residents age 1 and older had lived in a different home one year earlier, a measure that includes both local and longer-distance moves.
What age group is driving the most growth in Cave Spring?
The available Census profile does not identify one age group as the primary driver of growth. Its clearest age measure is a 42.4 median age, compared with 39.0 in Virginia and 38.9 nationally during 2020 to 2024.
Is Cave Spring affordable for in-movers compared to where they came from?
Housing costs vary according to a mover's prior market and income, but Cave Spring's median owner-occupied home value was $325,800 during 2020 to 2024. The same U.S. Census Bureau profile reported median monthly owner costs of $1,668 for mortgaged homes and median gross rent of $1,285.
How do migration trends affect home prices and rental rates in Cave Spring?
Migration can affect prices and rents when demand for suitable homes exceeds the available supply. Cave Spring's 69.5% owner-occupancy rate and 10.2% one-year household-mobility measure indicate measured turnover, which can make well-positioned homes and rentals more noticeable when they enter the market.
Talk Through the Cave Spring Market
Cave Spring migration and demographics show a stable, owner-oriented market where individual property features can matter greatly. Local context helps buyers, sellers, and investors assess how household stability, housing costs, and changing space needs may shape a specific opportunity.
Norm Pullen of NSR REALTY TEAM has been a REALTOR® since 2014 and holds a Virginia Real Estate Broker's license. He works with buyers, sellers, and investors in Cave Spring, and The Roanoke Times and The Roanoker Magazine have voted him Best Real Estate Agent multiple times since 2016. To discuss how local demand patterns relate to your next move, call or text (540) 330-6906, email norm@nsrrealty.com, or use the contact page.
Categories
Recent Posts










Realtor® | Team Lead | Broker Supervising Broker 0225279843
+1(540) 330-6906 | norm@nsrrealty.com